Text2Time Module Tutorial
This notebook demonstrates the use of pvops to analyze a combination of operations and maintenance (OM) and production data. The data will be processed and cleaned in preparation for an intersection analysis and subsequent visualizations.
Import modules
[1]:
import numpy as np
import pandas as pd
import matplotlib.pyplot as plt
import shutil
import sys
import os
[2]:
from pvops.text2time import visualize, utils, preprocess
from pvops.timeseries.models import linear, iec
1. Load and explore data
Define csv paths to OM, production, and meta data.
[3]:
example_OMpath = os.path.join('example_data', 'example_om_data2.csv')
example_prodpath = os.path.join('example_data', 'example_prod_data_cumE2.csv')
example_metapath = os.path.join('example_data', 'example_metadata2.csv')
Load in csv files as pandas DataFrames. prod_data contains energy production and irradiance data over time for potentially multiple sites. om_data contains operations and maintenance tickets. metadata contains information about the sites, such as location and DC size.
[4]:
prod_data = pd.read_csv(example_prodpath, on_bad_lines='skip', engine='python')
om_data = pd.read_csv(example_OMpath, on_bad_lines='skip', engine='python')
metadata = pd.read_csv(example_metapath, on_bad_lines='skip', engine='python')
Explore production data
[5]:
prod_data
[5]:
| randid | Date | Energy | Irradiance | |
|---|---|---|---|---|
| 0 | R23 | NaN | 1000.0 | NaN |
| 1 | R23 | 7/19/2018 1:00 | 1000.0 | NaN |
| 2 | R23 | 7/19/2018 2:00 | 0.0 | NaN |
| 3 | R23 | 7/19/2018 3:00 | 0.0 | NaN |
| 4 | R23 | 7/19/2018 4:00 | 1000.0 | NaN |
| ... | ... | ... | ... | ... |
| 1049 | R27 | 10/13/2018 23:45 | 5289528.0 | NaN |
| 1050 | R27 | 10/14/2018 0:00 | 5289528.0 | NaN |
| 1051 | R27 | 10/14/2018 0:15 | 5289528.0 | NaN |
| 1052 | R27 | 10/14/2018 0:30 | 5289528.0 | NaN |
| 1053 | R27 | 10/14/2018 0:45 | 5289528.0 | NaN |
1054 rows × 4 columns
Explore OM data
[6]:
om_data
[6]:
| randid | Asset | date_start | date_end | WONumber | WOType | GeneralDesc | |
|---|---|---|---|---|---|---|---|
| 0 | NaN | Inverter | 5/2/2018 12:00 | 5/17/2018 16:00 | 100 | Corrective | Inverter 1.1 Contactor 7, Inverter 1.2 Contact... |
| 1 | R23 | Facility | 5/19/2018 15:44 | 5/19/2018 13:04 | 101 | Preventive | Site offline due to grid disturbance |
| 2 | R23 | Facility | 6/15/2018 6:46 | 6/15/2018 10:30 | 102 | Corrective | Plant trip due to grid disturbance |
| 3 | R23 | Facility | 6/18/2018 11:20 | 6/18/2018 14:03 | 103 | Corrective | Site trip due to cause grid disturbance |
| 4 | R23 | Facility | 7/21/2018 4:45 | 7/21/2018 13:15 | 104 | Vegetation | Site tripped due to grid disturbance |
| 5 | R23 | Inverter | 7/21/2018 13:16 | 7/21/2018 14:25 | 105 | Corrective | Inverter failed to start following plant trip |
| 6 | R23 | Inverter | 7/25/2018 14:20 | 7/25/2018 16:40 | 106 | Corrective | inverter offline due to high ambient temp fault |
| 7 | R23 | Inverter | 8/1/2018 11:45 | NaN | 107 | Corrective | Inverter major underperformance |
| 8 | R23 | Facility | 8/2/2018 1:05 | 8/2/2018 9:28 | 108 | Corrective | Site trip due to grid disturbance |
| 9 | R27 | Facility | 9/14/2018 10:00 | 9/16/2018 16:00 | 1 | corrective | hurricane florence outages/response. complete ... |
| 10 | R27 | Facility | 9/24/2018 10:00 | 9/16/2018 17:00 | 2 | vegetation | Vegetation maintenance activities were performed |
| 11 | R27 | Other | 9/19/2018 7:00 | 10/11/2018 20:00 | 3 | corrective | hurricane response. perform site inspection to... |
| 12 | R27 | Facility | 10/13/2018 12:00 | 10/13/2018 17:00 | 4 | preventive | Monthly visual inspection |
| 13 | R27 | other | 10/14/2018 11:00 | NaN | 5 | preventive | Monthly visual inspection |
Explore metadata
[7]:
metadata
[7]:
| randid | DC_Size_kW | COD | latitude | longitude | |
|---|---|---|---|---|---|
| 0 | R23 | 2500 | 10/20/2013 | -80 | -35 |
| 1 | R27 | 475 | 10/21/2017 | -81 | -36 |
2. Prepare data for analysis
Assigning dictionaries to connect pvOps variables with user’s column names.
[8]:
#Format for dictionaries is {pvops variable: user-specific column names}
prod_col_dict = {'siteid': 'randid',
                 'timestamp': 'Date',
                 'energyprod': 'Energy',
                 'irradiance':'Irradiance',
                 'baseline': 'IEC_pstep', #user's name choice for new column (baseline expected energy defined by user or calculated based on IEC)
                 'dcsize': 'dcsize', #user's name choice for new column (System DC-size, extracted from meta-data)
                 'compared': 'Compared',#user's name choice for new column
                 'energy_pstep': 'Energy_pstep'} #user's name choice for new column

om_col_dict = {'siteid': 'randid',
               'datestart': 'date_start',
               'dateend': 'date_end',
               'workID': 'WONumber',
               'worktype': 'WOType',
               'asset': 'Asset',
               'eventdur': 'EventDur', #user's name choice for new column (Repair Duration)
               'modatestart': 'MonthStart', #user's name choice for new column (Month when an event begins)
               'agedatestart': 'AgeStart'} #user's name choice for new column (Age of system when event begins)

metad_col_dict = {'siteid': 'randid',
                  'dcsize': 'DC_Size_kW',
                  'COD': 'COD'}
2.1 Convert date strings to date-time objects
O&M Data
[9]:
#Note:  NaNs are converted to NaTs
om_data_converted = preprocess.om_date_convert(om_data, om_col_dict)

print('---Original data types---')
print(om_data.dtypes)
print('\n---Post-processed data types---')
print(om_data_converted.dtypes)
print('\n---Converted data frame---')
om_data_converted.head()
---Original data types---
randid         object
Asset          object
date_start     object
date_end       object
WONumber        int64
WOType         object
GeneralDesc    object
dtype: object

---Post-processed data types---
randid                 object
Asset                  object
date_start     datetime64[ns]
date_end       datetime64[ns]
WONumber                int64
WOType                 object
GeneralDesc            object
dtype: object

---Converted data frame---
[9]:
| randid | Asset | date_start | date_end | WONumber | WOType | GeneralDesc | |
|---|---|---|---|---|---|---|---|
| 0 | NaN | Inverter | 2018-05-02 12:00:00 | 2018-05-17 16:00:00 | 100 | Corrective | Inverter 1.1 Contactor 7, Inverter 1.2 Contact... |
| 1 | R23 | Facility | 2018-05-19 15:44:00 | 2018-05-19 13:04:00 | 101 | Preventive | Site offline due to grid disturbance |
| 2 | R23 | Facility | 2018-06-15 06:46:00 | 2018-06-15 10:30:00 | 102 | Corrective | Plant trip due to grid disturbance |
| 3 | R23 | Facility | 2018-06-18 11:20:00 | 2018-06-18 14:03:00 | 103 | Corrective | Site trip due to cause grid disturbance |
| 4 | R23 | Facility | 2018-07-21 04:45:00 | 2018-07-21 13:15:00 | 104 | Vegetation | Site tripped due to grid disturbance |
Production data
[10]:
prod_data_converted = preprocess.prod_date_convert(prod_data, prod_col_dict)

print('---Original data types---')
print(prod_data.dtypes)
print('\n---Post-processed data types---')
print(prod_data_converted.dtypes)
print('\n---Converted data frame---')
prod_data_converted.head()
---Original data types---
randid         object
Date           object
Energy        float64
Irradiance    float64
dtype: object

---Post-processed data types---
randid                object
Date          datetime64[ns]
Energy               float64
Irradiance           float64
dtype: object

---Converted data frame---
[10]:
| randid | Date | Energy | Irradiance | |
|---|---|---|---|---|
| 0 | R23 | NaT | 1000.0 | NaN |
| 1 | R23 | 2018-07-19 01:00:00 | 1000.0 | NaN |
| 2 | R23 | 2018-07-19 02:00:00 | 0.0 | NaN |
| 3 | R23 | 2018-07-19 03:00:00 | 0.0 | NaN |
| 4 | R23 | 2018-07-19 04:00:00 | 1000.0 | NaN |
3. Handling data quality issues
3.1 Missing site-IDs
Drop rows where site-ID is NAN in OM-data (helpful when multiple sites are in O&M data frame and a NAN doesn’t identify a specific site)
[11]:
om_data_sitena, addressed = preprocess.data_site_na(om_data_converted, om_col_dict)
addressed #printing row that was addressed
[11]:
| randid | Asset | date_start | date_end | WONumber | WOType | GeneralDesc | |
|---|---|---|---|---|---|---|---|
| 0 | NaN | Inverter | 2018-05-02 12:00:00 | 2018-05-17 16:00:00 | 100 | Corrective | Inverter 1.1 Contactor 7, Inverter 1.2 Contact... |
Print post-processed data frame
[12]:
om_data_sitena.head()
[12]:
| randid | Asset | date_start | date_end | WONumber | WOType | GeneralDesc | |
|---|---|---|---|---|---|---|---|
| 1 | R23 | Facility | 2018-05-19 15:44:00 | 2018-05-19 13:04:00 | 101 | Preventive | Site offline due to grid disturbance |
| 2 | R23 | Facility | 2018-06-15 06:46:00 | 2018-06-15 10:30:00 | 102 | Corrective | Plant trip due to grid disturbance |
| 3 | R23 | Facility | 2018-06-18 11:20:00 | 2018-06-18 14:03:00 | 103 | Corrective | Site trip due to cause grid disturbance |
| 4 | R23 | Facility | 2018-07-21 04:45:00 | 2018-07-21 13:15:00 | 104 | Vegetation | Site tripped due to grid disturbance |
| 5 | R23 | Inverter | 2018-07-21 13:16:00 | 2018-07-21 14:25:00 | 105 | Corrective | Inverter failed to start following plant trip |
3.2 O&M Start-dates that occur after concluding date (inverted dates)
Addressing issue by swapping dates
[13]:
om_data_checked_s, addressed = preprocess.om_datelogic_check(om_data_sitena, om_col_dict, 'swap')
addressed
[13]:
| randid | Asset | date_start | date_end | WONumber | WOType | GeneralDesc | |
|---|---|---|---|---|---|---|---|
| 1 | R23 | Facility | 2018-05-19 15:44:00 | 2018-05-19 13:04:00 | 101 | Preventive | Site offline due to grid disturbance |
| 10 | R27 | Facility | 2018-09-24 10:00:00 | 2018-09-16 17:00:00 | 2 | vegetation | Vegetation maintenance activities were performed |
Print post-processed data frame
[14]:
om_data_checked_s.head()
[14]:
| randid | Asset | date_start | date_end | WONumber | WOType | GeneralDesc | |
|---|---|---|---|---|---|---|---|
| 1 | R23 | Facility | 2018-05-19 13:04:00 | 2018-05-19 15:44:00 | 101 | Preventive | Site offline due to grid disturbance |
| 2 | R23 | Facility | 2018-06-15 06:46:00 | 2018-06-15 10:30:00 | 102 | Corrective | Plant trip due to grid disturbance |
| 3 | R23 | Facility | 2018-06-18 11:20:00 | 2018-06-18 14:03:00 | 103 | Corrective | Site trip due to cause grid disturbance |
| 4 | R23 | Facility | 2018-07-21 04:45:00 | 2018-07-21 13:15:00 | 104 | Vegetation | Site tripped due to grid disturbance |
| 5 | R23 | Inverter | 2018-07-21 13:16:00 | 2018-07-21 14:25:00 | 105 | Corrective | Inverter failed to start following plant trip |
Addressing issue by dropping rows instead of swapping dates
[15]:
om_data_checked_d, date_error = preprocess.om_datelogic_check(om_data_sitena, om_col_dict, 'drop')
om_data_checked_d.head()
[15]:
| randid | Asset | date_start | date_end | WONumber | WOType | GeneralDesc | |
|---|---|---|---|---|---|---|---|
| 2 | R23 | Facility | 2018-06-15 06:46:00 | 2018-06-15 10:30:00 | 102 | Corrective | Plant trip due to grid disturbance |
| 3 | R23 | Facility | 2018-06-18 11:20:00 | 2018-06-18 14:03:00 | 103 | Corrective | Site trip due to cause grid disturbance |
| 4 | R23 | Facility | 2018-07-21 04:45:00 | 2018-07-21 13:15:00 | 104 | Vegetation | Site tripped due to grid disturbance |
| 5 | R23 | Inverter | 2018-07-21 13:16:00 | 2018-07-21 14:25:00 | 105 | Corrective | Inverter failed to start following plant trip |
| 6 | R23 | Inverter | 2018-07-25 14:20:00 | 2018-07-25 16:40:00 | 106 | Corrective | inverter offline due to high ambient temp fault |
3.3 Unexpected drops in energy delivered (when collected on cumulative basis)
Visualize pre-processed data
[16]:
plotvar = 'Energy'
for sid in prod_data_converted.loc[:, 'randid'].unique():
    mask = prod_data_converted.loc[:, 'randid']== sid
    prod_data_converted.loc[mask].plot(x='Date',y=plotvar, title=sid)
    plt.ylabel('Joules')


Addressing issue by forward-filling, which propagates last valid observation forward.
[17]:
prod_data_anom, addressed = utils.prod_anomalies(prod_data_converted, prod_col_dict, 1.0, np.nan, ffill=True)
addressed
[17]:
| randid | Date | Energy | Irradiance | |
|---|---|---|---|---|
| 2 | R23 | 2018-07-19 02:00:00 | 0.0 | NaN |
| 3 | R23 | 2018-07-19 03:00:00 | 0.0 | NaN |
| 194 | R23 | 2018-07-27 02:00:00 | 0.0 | NaN |
| 395 | R27 | 2018-09-14 04:00:00 | 0.0 | 0.616897 |
| 397 | R27 | 2018-09-14 04:30:00 | 0.0 | 0.306548 |
| 860 | R27 | 2018-09-19 00:15:00 | 0.0 | 0.000000 |
Print post-processed data frame
[18]:
prod_data_anom
[18]:
| randid | Date | Energy | Irradiance | |
|---|---|---|---|---|
| 0 | R23 | NaT | 1000.0 | NaN |
| 1 | R23 | 2018-07-19 01:00:00 | 1000.0 | NaN |
| 2 | R23 | 2018-07-19 02:00:00 | 1000.0 | NaN |
| 3 | R23 | 2018-07-19 03:00:00 | 1000.0 | NaN |
| 4 | R23 | 2018-07-19 04:00:00 | 1000.0 | NaN |
| ... | ... | ... | ... | ... |
| 1049 | R27 | 2018-10-13 23:45:00 | 5289528.0 | NaN |
| 1050 | R27 | 2018-10-14 00:00:00 | 5289528.0 | NaN |
| 1051 | R27 | 2018-10-14 00:15:00 | 5289528.0 | NaN |
| 1052 | R27 | 2018-10-14 00:30:00 | 5289528.0 | NaN |
| 1053 | R27 | 2018-10-14 00:45:00 | 5289528.0 | NaN |
1054 rows × 4 columns
Quick visualization of post-processed data
[19]:
plotvar = 'Energy'
for sid in prod_data_anom.loc[:, 'randid'].unique():
    mask = prod_data_anom.loc[:, 'randid']== sid
    prod_data_anom.loc[mask].plot(x='Date',y=plotvar, title=sid)
    plt.ylabel('Joules')


3.4 Missing time-stamps in data
Production Data
Dropping rows with missing time-stamps
[20]:
prod_data_datena_d, addressed = preprocess.prod_nadate_process(prod_data_anom, prod_col_dict, pnadrop=True)
addressed
[20]:
| randid | Date | Energy | Irradiance | |
|---|---|---|---|---|
| 0 | R23 | NaT | 1000.0 | NaN |
| 388 | R27 | NaT | 5220831.0 | 0.095835 |
Print post-processed data frame
[21]:
prod_data_datena_d
[21]:
| randid | Date | Energy | Irradiance | |
|---|---|---|---|---|
| 1 | R23 | 2018-07-19 01:00:00 | 1000.0 | NaN |
| 2 | R23 | 2018-07-19 02:00:00 | 1000.0 | NaN |
| 3 | R23 | 2018-07-19 03:00:00 | 1000.0 | NaN |
| 4 | R23 | 2018-07-19 04:00:00 | 1000.0 | NaN |
| 5 | R23 | 2018-07-19 05:00:00 | 1000.0 | NaN |
| ... | ... | ... | ... | ... |
| 1049 | R27 | 2018-10-13 23:45:00 | 5289528.0 | NaN |
| 1050 | R27 | 2018-10-14 00:00:00 | 5289528.0 | NaN |
| 1051 | R27 | 2018-10-14 00:15:00 | 5289528.0 | NaN |
| 1052 | R27 | 2018-10-14 00:30:00 | 5289528.0 | NaN |
| 1053 | R27 | 2018-10-14 00:45:00 | 5289528.0 | NaN |
1052 rows × 4 columns
Identifying rows with missing time-stamps but not dropping them
[22]:
prod_data_datena_id, addressed = preprocess.prod_nadate_process(prod_data_anom, prod_col_dict, pnadrop=False)
prod_data_datena_id
[22]:
| randid | Date | Energy | Irradiance | |
|---|---|---|---|---|
| 0 | R23 | NaT | 1000.0 | NaN |
| 1 | R23 | 2018-07-19 01:00:00 | 1000.0 | NaN |
| 2 | R23 | 2018-07-19 02:00:00 | 1000.0 | NaN |
| 3 | R23 | 2018-07-19 03:00:00 | 1000.0 | NaN |
| 4 | R23 | 2018-07-19 04:00:00 | 1000.0 | NaN |
| ... | ... | ... | ... | ... |
| 1049 | R27 | 2018-10-13 23:45:00 | 5289528.0 | NaN |
| 1050 | R27 | 2018-10-14 00:00:00 | 5289528.0 | NaN |
| 1051 | R27 | 2018-10-14 00:15:00 | 5289528.0 | NaN |
| 1052 | R27 | 2018-10-14 00:30:00 | 5289528.0 | NaN |
| 1053 | R27 | 2018-10-14 00:45:00 | 5289528.0 | NaN |
1054 rows × 4 columns
O&M Data
Dropping rows when end-date of an event is missing
[23]:
om_data_datena_d, addressed = preprocess.om_nadate_process(om_data_checked_s, om_col_dict, om_dendflag='drop')
addressed
[23]:
| randid | Asset | date_start | date_end | WONumber | WOType | GeneralDesc | |
|---|---|---|---|---|---|---|---|
| 7 | R23 | Inverter | 2018-08-01 11:45:00 | NaT | 107 | Corrective | Inverter major underperformance |
| 13 | R27 | other | 2018-10-14 11:00:00 | NaT | 5 | preventive | Monthly visual inspection |
Print post-processed data frame
[24]:
om_data_datena_d
[24]:
| randid | Asset | date_start | date_end | WONumber | WOType | GeneralDesc | |
|---|---|---|---|---|---|---|---|
| 1 | R23 | Facility | 2018-05-19 13:04:00 | 2018-05-19 15:44:00 | 101 | Preventive | Site offline due to grid disturbance |
| 2 | R23 | Facility | 2018-06-15 06:46:00 | 2018-06-15 10:30:00 | 102 | Corrective | Plant trip due to grid disturbance |
| 3 | R23 | Facility | 2018-06-18 11:20:00 | 2018-06-18 14:03:00 | 103 | Corrective | Site trip due to cause grid disturbance |
| 4 | R23 | Facility | 2018-07-21 04:45:00 | 2018-07-21 13:15:00 | 104 | Vegetation | Site tripped due to grid disturbance |
| 5 | R23 | Inverter | 2018-07-21 13:16:00 | 2018-07-21 14:25:00 | 105 | Corrective | Inverter failed to start following plant trip |
| 6 | R23 | Inverter | 2018-07-25 14:20:00 | 2018-07-25 16:40:00 | 106 | Corrective | inverter offline due to high ambient temp fault |
| 8 | R23 | Facility | 2018-08-02 01:05:00 | 2018-08-02 09:28:00 | 108 | Corrective | Site trip due to grid disturbance |
| 9 | R27 | Facility | 2018-09-14 10:00:00 | 2018-09-16 16:00:00 | 1 | corrective | hurricane florence outages/response. complete ... |
| 10 | R27 | Facility | 2018-05-19 13:04:00 | 2018-05-19 15:44:00 | 2 | vegetation | Vegetation maintenance activities were performed |
| 11 | R27 | Other | 2018-09-19 07:00:00 | 2018-10-11 20:00:00 | 3 | corrective | hurricane response. perform site inspection to... |
| 12 | R27 | Facility | 2018-10-13 12:00:00 | 2018-10-13 17:00:00 | 4 | preventive | Monthly visual inspection |
Rather than dropping rows, assigning “today’s” time-stamp for missing end-dates to consider an open ticket
[25]:
om_data_datena_t, addressed = preprocess.om_nadate_process(om_data_checked_s, om_col_dict, om_dendflag='today')
om_data_datena_t
[25]:
| randid | Asset | date_start | date_end | WONumber | WOType | GeneralDesc | |
|---|---|---|---|---|---|---|---|
| 1 | R23 | Facility | 2018-05-19 13:04:00 | 2018-05-19 15:44:00 | 101 | Preventive | Site offline due to grid disturbance |
| 2 | R23 | Facility | 2018-06-15 06:46:00 | 2018-06-15 10:30:00 | 102 | Corrective | Plant trip due to grid disturbance |
| 3 | R23 | Facility | 2018-06-18 11:20:00 | 2018-06-18 14:03:00 | 103 | Corrective | Site trip due to cause grid disturbance |
| 4 | R23 | Facility | 2018-07-21 04:45:00 | 2018-07-21 13:15:00 | 104 | Vegetation | Site tripped due to grid disturbance |
| 5 | R23 | Inverter | 2018-07-21 13:16:00 | 2018-07-21 14:25:00 | 105 | Corrective | Inverter failed to start following plant trip |
| 6 | R23 | Inverter | 2018-07-25 14:20:00 | 2018-07-25 16:40:00 | 106 | Corrective | inverter offline due to high ambient temp fault |
| 7 | R23 | Inverter | 2018-08-01 11:45:00 | 2023-01-12 12:26:26 | 107 | Corrective | Inverter major underperformance |
| 8 | R23 | Facility | 2018-08-02 01:05:00 | 2018-08-02 09:28:00 | 108 | Corrective | Site trip due to grid disturbance |
| 9 | R27 | Facility | 2018-09-14 10:00:00 | 2018-09-16 16:00:00 | 1 | corrective | hurricane florence outages/response. complete ... |
| 10 | R27 | Facility | 2018-05-19 13:04:00 | 2018-05-19 15:44:00 | 2 | vegetation | Vegetation maintenance activities were performed |
| 11 | R27 | Other | 2018-09-19 07:00:00 | 2018-10-11 20:00:00 | 3 | corrective | hurricane response. perform site inspection to... |
| 12 | R27 | Facility | 2018-10-13 12:00:00 | 2018-10-13 17:00:00 | 4 | preventive | Monthly visual inspection |
| 13 | R27 | other | 2018-10-14 11:00:00 | 2023-01-12 12:26:26 | 5 | preventive | Monthly visual inspection |
4. Pre-visualizing preparation
4.1 Print out overview of the overlap of OM and production data
prod_summary indicates how many time stamps overlapped with OM data versus the total number of time stamps, broken down by site. om_data indicates the lower and upper time bounds on OM data and the number of events, broken down by site.
[26]:
prod_summary, om_summary = utils.summarize_overlaps(prod_data_datena_d, om_data_datena_t, prod_col_dict, om_col_dict)
Production
[27]:
prod_summary
[27]:
| Actual # Time Stamps | Max # Time Stamps | |
|---|---|---|
| randid | ||
| R23 | 387 | 387 |
| R27 | 665 | 665 |
O&M
[28]:
om_summary
[28]:
| Earliest Event Start | Latest Event End | Total Events | |
|---|---|---|---|
| randid | |||
| R23 | 2018-07-21 04:45:00 | 2023-01-12 12:26:26 | 5 |
| R27 | 2018-09-14 10:00:00 | 2018-10-13 17:00:00 | 3 |
4.2 Extract overlapping data
[29]:
prod_data_clean, om_data_clean = utils.overlapping_data(prod_data_datena_d, om_data_datena_d, prod_col_dict, om_col_dict)
Print post-processed production data frame
[30]:
prod_data_clean
[30]:
| randid | Date | Energy | Irradiance | |
|---|---|---|---|---|
| 0 | R23 | 2018-07-19 01:00:00 | 1000.0 | NaN |
| 1 | R23 | 2018-07-19 02:00:00 | 1000.0 | NaN |
| 2 | R23 | 2018-07-19 03:00:00 | 1000.0 | NaN |
| 3 | R23 | 2018-07-19 04:00:00 | 1000.0 | NaN |
| 4 | R23 | 2018-07-19 05:00:00 | 1000.0 | NaN |
| ... | ... | ... | ... | ... |
| 1015 | R27 | 2018-10-13 22:45:00 | 5289528.0 | 0.0 |
| 1016 | R27 | 2018-10-13 23:00:00 | 5289528.0 | 0.0 |
| 1017 | R27 | 2018-10-13 23:15:00 | 5289528.0 | NaN |
| 1018 | R27 | 2018-10-13 23:30:00 | 5289528.0 | NaN |
| 1019 | R27 | 2018-10-13 23:45:00 | 5289528.0 | NaN |
1020 rows × 4 columns
Print post-processed O&M data frame
[31]:
om_data_clean
[31]:
| randid | Asset | date_start | date_end | WONumber | WOType | GeneralDesc | |
|---|---|---|---|---|---|---|---|
| 0 | R23 | Facility | 2018-07-21 04:45:00 | 2018-07-21 13:15:00 | 104 | Vegetation | Site tripped due to grid disturbance |
| 1 | R23 | Inverter | 2018-07-21 13:16:00 | 2018-07-21 14:25:00 | 105 | Corrective | Inverter failed to start following plant trip |
| 2 | R23 | Inverter | 2018-07-25 14:20:00 | 2018-07-25 16:40:00 | 106 | Corrective | inverter offline due to high ambient temp fault |
| 3 | R23 | Facility | 2018-08-02 01:05:00 | 2018-08-02 09:28:00 | 108 | Corrective | Site trip due to grid disturbance |
| 4 | R27 | Facility | 2018-09-14 10:00:00 | 2018-09-16 16:00:00 | 1 | corrective | hurricane florence outages/response. complete ... |
| 5 | R27 | Other | 2018-09-19 07:00:00 | 2018-10-11 20:00:00 | 3 | corrective | hurricane response. perform site inspection to... |
| 6 | R27 | Facility | 2018-10-13 12:00:00 | 2018-10-13 17:00:00 | 4 | preventive | Monthly visual inspection |
4.3 Calculate reference production data using IEC standards
[32]:
prod_data_clean_iec = iec.iec_calc(prod_data_clean, prod_col_dict, metadata, metad_col_dict, gi_ref=1000.)
Expected energy is calculated based on irradiance information and shows up as a new column in the production data frame.
[33]:
prod_data_clean_iec.head(n=15)
[33]:
| randid | Date | Energy | Irradiance | IEC_pstep | |
|---|---|---|---|---|---|
| 0 | R23 | 2018-07-19 01:00:00 | 1000.000 | NaN | NaN |
| 1 | R23 | 2018-07-19 02:00:00 | 1000.000 | NaN | NaN |
| 2 | R23 | 2018-07-19 03:00:00 | 1000.000 | NaN | NaN |
| 3 | R23 | 2018-07-19 04:00:00 | 1000.000 | NaN | NaN |
| 4 | R23 | 2018-07-19 05:00:00 | 1000.000 | NaN | NaN |
| 5 | R23 | 2018-07-19 06:00:00 | 1000.000 | NaN | NaN |
| 6 | R23 | 2018-07-19 07:00:00 | 1032.712 | 28.6245 | 71.56125 |
| 7 | R23 | 2018-07-19 08:00:00 | 1217.521 | 136.8305 | 342.07625 |
| 8 | R23 | 2018-07-19 09:00:00 | 1889.859 | 347.5645 | 868.91125 |
| 9 | R23 | 2018-07-19 10:00:00 | 3073.485 | 565.9015 | 1414.75375 |
| 10 | R23 | 2018-07-19 11:00:00 | 4662.416 | 754.6965 | 1886.74125 |
| 11 | R23 | 2018-07-19 12:00:00 | 6518.864 | 896.4945 | 2241.23625 |
| 12 | R23 | 2018-07-19 13:00:00 | 8469.309 | 984.3710 | 2460.92750 |
| 13 | R23 | 2018-07-19 14:00:00 | 10059.862 | 1018.6565 | 2546.64125 |
| 14 | R23 | 2018-07-19 15:00:00 | 11122.754 | 339.1815 | 847.95375 |
4.4 Calculating a comparison of production data relative to baseline
Calculate as a ratio (actual/baseline)
[34]:
prod_data_quant = utils.prod_quant(prod_data_clean_iec, prod_col_dict, comp_type='norm', ecumu=True)
prod_data_quant.head(10)
[34]:
| randid | Date | Energy | Irradiance | IEC_pstep | Energy_pstep | Compared | |
|---|---|---|---|---|---|---|---|
| 0 | R23 | 2018-07-19 01:00:00 | 1000.000 | NaN | NaN | NaN | NaN |
| 1 | R23 | 2018-07-19 02:00:00 | 1000.000 | NaN | NaN | 0.000 | NaN |
| 2 | R23 | 2018-07-19 03:00:00 | 1000.000 | NaN | NaN | 0.000 | NaN |
| 3 | R23 | 2018-07-19 04:00:00 | 1000.000 | NaN | NaN | 0.000 | NaN |
| 4 | R23 | 2018-07-19 05:00:00 | 1000.000 | NaN | NaN | 0.000 | NaN |
| 5 | R23 | 2018-07-19 06:00:00 | 1000.000 | NaN | NaN | 0.000 | NaN |
| 6 | R23 | 2018-07-19 07:00:00 | 1032.712 | 28.6245 | 71.56125 | 32.712 | 0.457119 |
| 7 | R23 | 2018-07-19 08:00:00 | 1217.521 | 136.8305 | 342.07625 | 184.809 | 0.540257 |
| 8 | R23 | 2018-07-19 09:00:00 | 1889.859 | 347.5645 | 868.91125 | 672.338 | 0.773771 |
| 9 | R23 | 2018-07-19 10:00:00 | 3073.485 | 565.9015 | 1414.75375 | 1183.626 | 0.836630 |
Calculate as a difference (baseline-actual)
[35]:
prod_data_quant = utils.prod_quant(prod_data_clean_iec, prod_col_dict, comp_type='diff', ecumu=True)
prod_data_quant.head(10)
[35]:
| randid | Date | Energy | Irradiance | IEC_pstep | Energy_pstep | Compared | |
|---|---|---|---|---|---|---|---|
| 0 | R23 | 2018-07-19 01:00:00 | 1000.000 | NaN | NaN | NaN | NaN |
| 1 | R23 | 2018-07-19 02:00:00 | 1000.000 | NaN | NaN | 0.000 | NaN |
| 2 | R23 | 2018-07-19 03:00:00 | 1000.000 | NaN | NaN | 0.000 | NaN |
| 3 | R23 | 2018-07-19 04:00:00 | 1000.000 | NaN | NaN | 0.000 | NaN |
| 4 | R23 | 2018-07-19 05:00:00 | 1000.000 | NaN | NaN | 0.000 | NaN |
| 5 | R23 | 2018-07-19 06:00:00 | 1000.000 | NaN | NaN | 0.000 | NaN |
| 6 | R23 | 2018-07-19 07:00:00 | 1032.712 | 28.6245 | 71.56125 | 32.712 | 38.84925 |
| 7 | R23 | 2018-07-19 08:00:00 | 1217.521 | 136.8305 | 342.07625 | 184.809 | 157.26725 |
| 8 | R23 | 2018-07-19 09:00:00 | 1889.859 | 347.5645 | 868.91125 | 672.338 | 196.57325 |
| 9 | R23 | 2018-07-19 10:00:00 | 3073.485 | 565.9015 | 1414.75375 | 1183.626 | 231.12775 |
5. Visualizations
5.1 Visualizing overlapping production and O&M data
Making directories to store generated visualizations.
[36]:
#User should modify paths as needed
main_fldr = 'analysis'
if os.path.isdir(main_fldr):
    shutil.rmtree(main_fldr)
prod_fldr = os.path.join(main_fldr, 'perf_plots')
site_fldr = os.path.join(main_fldr, 'site_plots')
os.makedirs(prod_fldr)
os.makedirs(site_fldr)
Making visualizations
[37]:
figs = visualize.visualize_om_prod_overlap(prod_data_quant, om_data_clean, prod_col_dict, om_col_dict, prod_fldr=prod_fldr, e_cumu=True, be_cumu=False, samp_freq='H', pshift=0.0, baselineflag=True)
Display figure handles of overlapping data (“figs” contains one figure per site in overlapping data frames)
[38]:
for i in range(len(figs)):
    figs[i].show()
Data type cannot be displayed: application/vnd.plotly.v1+json
Data type cannot be displayed: application/vnd.plotly.v1+json
5.2 Calculate additional O&M metrics and generate relevant plots
Calculating individual event duration and age of system at time of event occurence
[39]:
om_data_update = utils.om_summary_stats(om_data_clean, metadata, om_col_dict, metad_col_dict)
om_data_update.head()
[39]:
| randid | Asset | date_start | date_end | WONumber | WOType | GeneralDesc | EventDur | MonthStart | COD | AgeStart | |
|---|---|---|---|---|---|---|---|---|---|---|---|
| 0 | R23 | Facility | 2018-07-21 04:45:00 | 2018-07-21 13:15:00 | 104 | Vegetation | Site tripped due to grid disturbance | 8.500000 | 7 | 2013-10-20 | 1735 |
| 1 | R23 | Inverter | 2018-07-21 13:16:00 | 2018-07-21 14:25:00 | 105 | Corrective | Inverter failed to start following plant trip | 1.150000 | 7 | 2013-10-20 | 1736 |
| 2 | R23 | Inverter | 2018-07-25 14:20:00 | 2018-07-25 16:40:00 | 106 | Corrective | inverter offline due to high ambient temp fault | 2.333333 | 7 | 2013-10-20 | 1740 |
| 3 | R23 | Facility | 2018-08-02 01:05:00 | 2018-08-02 09:28:00 | 108 | Corrective | Site trip due to grid disturbance | 8.383333 | 8 | 2013-10-20 | 1747 |
| 4 | R27 | Facility | 2018-09-14 10:00:00 | 2018-09-16 16:00:00 | 1 | corrective | hurricane florence outages/response. complete ... | 6.000000 | 9 | 2017-10-21 | 328 |
Setting Seaborn fig and font settings (inputs to count_fig and catscat_fig below)
[40]:
my_figsize = (12,10)
my_fontsize = 20
my_savedpi = 300
fig_sets = {'figsize': my_figsize,
            'fontsize': my_fontsize
            }
Creating scatter-plot of system age at beginning of each event, per site
[41]:
cat_varx = om_col_dict['siteid']
cat_vary= om_col_dict['agedatestart']
sv_nm = 'system_age.png'
myfig = visualize.visualize_categorical_scatter(om_data_update, om_col_dict, cat_varx, cat_vary, fig_sets)

Creating scatter-plot of each event-duration, per site
[42]:
cat_varx = om_col_dict['siteid']
cat_vary= om_col_dict['eventdur']
sv_nm = 'event_dur.png'
myfig = visualize.visualize_categorical_scatter(om_data_update, om_col_dict, cat_varx, cat_vary, fig_sets)

Count-plot of # of events, per site
[43]:
count_var = om_col_dict['siteid']
sv_nm = 'event_count_per_site.png'
myfig = visualize.visualize_counts(om_data_update, om_col_dict, count_var, fig_sets)

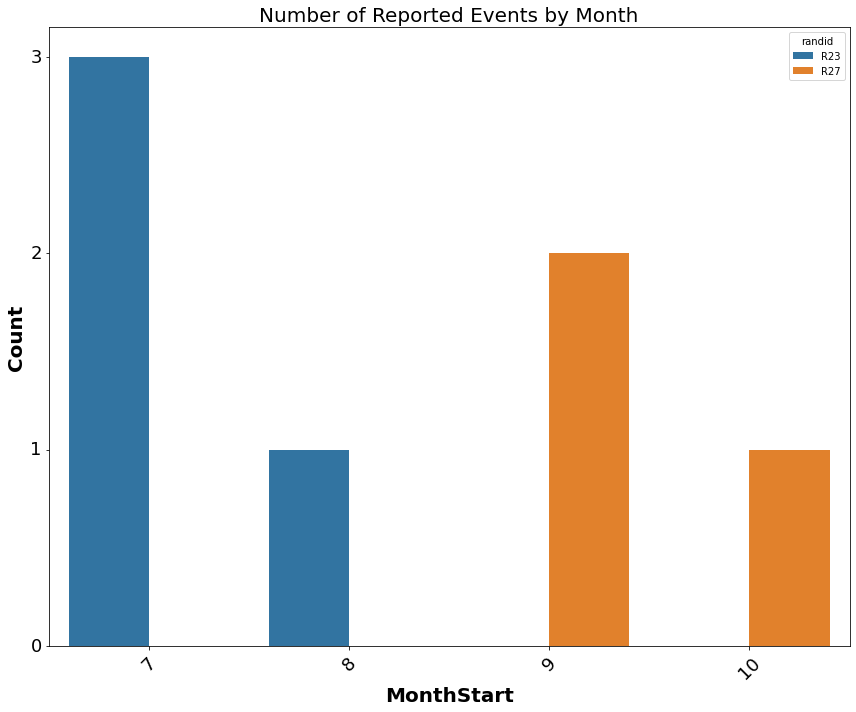
Count-plot of # of events, per month
[44]:
count_var = om_col_dict['modatestart']
sv_nm = 'event_count_per_month.png'
myfig = visualize.visualize_counts(om_data_update, om_col_dict, count_var, fig_sets)