Text Module Tutorial
[56]:
import pandas as pd
import matplotlib.pyplot as plt

from pvops.text import utils
import text_class_example
Problem statements:
1. Text Preprocessing
Process the documents into concise, machine learning-ready documents. Additionally, extract dates from the text.
2. Text Classification
The written tickets are used to make an inference on the specified event descriptor.
Text processing
Import text data
[57]:
folder = 'example_data//'
filename = 'example_ML_ticket_data.csv'
df = pd.read_csv(folder+filename)
df.head(n=3)
[57]:
| Date_EventStart | Date_EventEnd | Asset | CompletionDesc | Cause | ImpactLevel | randid | |
|---|---|---|---|---|---|---|---|
| 0 | 8/16/2018 9:00 | 8/22/2018 17:00 | Combiner | cb 1.18 was found to have contactor issue woul... | 0000 - Unknown. | Underperformance | 38 |
| 1 | 9/17/2018 18:25 | 9/18/2018 9:50 | Pad | self resolved. techdispatched: no | 004 - Under voltage. | Underperformance | 46 |
| 2 | 8/26/2019 9:00 | 11/5/2019 17:00 | Facility | all module rows washed, waiting for final repo... | 0000 - Unknown | Underperformance | 62 |
Establish settings
Specify column names which will be used in this pipeline.
[58]:
DATA_COLUMN = "CompletionDesc"   # Contains document
LABEL_COLUMN = "Asset"           # Establish event descriptor which will be inferenced by classifiers
DATE_COLUMN = 'Date_EventStart'  # Date of ticket (start date, end date; any reflective date will do), used in date extracting pipeline to replace information not specified in ticket
Step 0: If needed, map raw labels to a cleaner set of labels
[59]:
asset_remap_filename = 'remappings_asset.csv'
REMAPPING_COL_FROM = 'in'
REMAPPING_COL_TO = 'out_'
remapping_df = pd.read_csv(folder+asset_remap_filename)
[60]:
remapping_col_dict = {
    'attribute_col': LABEL_COLUMN,
    'remapping_col_from': REMAPPING_COL_FROM,
    'remapping_col_to': REMAPPING_COL_TO
}

df_remapped_assets = utils.remap_attributes(df.iloc[30:].copy(), remapping_df.iloc[20:].copy(), remapping_col_dict, allow_missing_mappings=True)

df = df_remapped_assets
[61]:
df[LABEL_COLUMN].value_counts()
[61]:
Asset
inverter                  26
facility                  24
tracker                    6
combiner                   4
substation                 2
other                      2
transformer                1
ground-mount pv system     1
energy storage             1
energy meter               1
met station                1
pyranometer                1
Name: count, dtype: int64
Step 1: Establish example instance and render preliminary information about the tickets
[62]:
# Establish the class object (found in text_class_example.py)
print(df[LABEL_COLUMN].value_counts())

e = text_class_example.Example(df, LABEL_COLUMN)
e.summarize_text_data(DATA_COLUMN)
Asset
inverter                  26
facility                  24
tracker                    6
combiner                   4
substation                 2
other                      2
transformer                1
ground-mount pv system     1
energy storage             1
energy meter               1
met station                1
pyranometer                1
Name: count, dtype: int64
DETAILS
  70 samples
  0 invalid documents
  29.16 words per sample on average
  Number of unique words 881
  2041.00 total words
Visualize timeseries of ticket publications
[63]:
fig = e.visualize_attribute_timeseries(DATE_COLUMN)
plt.show()

Functionality 1.1: Extract dates
[64]:
# Extract date from ticket, if any. This framework is not 100% correct.
dates_df = e.extract_dates(DATA_COLUMN, DATE_COLUMN, SAVE_DATE_COLUMN='ExtractedDates')
dates_df
[64]:
| CompletionDesc | ExtractedDates | |
|---|---|---|
| 0 | 8/39/19 inverter was faulted with lp15 (low pr... | [2019-08-17 07:35:00] |
| 1 | 11,july 2018 -upon arrival w-a6-2, inverter is... | [2018-07-11 18:55:00, 2018-06-02 18:55:00, 201... |
| 2 | arrived site checked into c4. i was able to pi... | [2020-05-26 14:45:00] |
| 3 | c4 closed site remotely. techdispatched: no | [] |
| 4 | inspection troubleshooting malfunctioning trac... | [] |
| ... | ... | ... |
| 65 | cleared cleared alert however psi is -3 invert... | [2016-11-03 09:28:00] |
| 66 | c4 closed remotely. techdispatched: no | [] |
| 67 | pure power fixed damaged source circuits did f... | [2019-04-16 09:00:00, 2019-03-16 15:15:00] |
| 68 | checked network connection to rm-1 didn't see ... | [] |
| 69 | utility outage from 6/5 7am through 6/8 5:30pm... | [2017-06-05 07:17:00, 2017-06-08 17:30:00] |
70 rows × 2 columns
Functionality 1.2: Preprocess data for the Machine Learning classification
[65]:
preprocessed_df = e.prep_data_for_ML(DATA_COLUMN, DATE_COLUMN)
preprocessed_df
[65]:
| CompletionDesc | CleanDesc | |
|---|---|---|
| 0 | either reboot datalogger worked, issue resolve... | either reboot datalogger worked issue resolved... |
| 1 | . techdispatched: no | techdispatched |
| 2 | inverter resolved. techdispatched: no | inverter resolved techdispatched |
| 3 | 10/2/19 e-1, row 51, e1-3-51-1. tracker tracki... | row tracker tracking wrong lubed gear boxes tr... |
| 4 | confirmed that cb 1.1.6 was turned off. verifi... | confirmed cb turned verified voltage array tur... |
| ... | ... | ... |
| 59 | c4 closed remotely. techdispatched: no | closed remotely techdispatched |
| 60 | switchgear breaker for 2.6 was tripped. breake... | switchgear breaker tripped breaker inverter tr... |
| 61 | . techdispatched: no | techdispatched |
| 62 | resolved.. techdispatched: no | resolved techdispatched |
| 63 | 8/39/19 inverter was faulted with lp15 (low pr... | inverter faulted lp low pressure inverter show... |
64 rows × 2 columns
Results of text processing
[66]:
print("Pre-text processing")
e.summarize_text_data(DATA_COLUMN)

print("\nPost-text processing")
e.summarize_text_data('CleanDesc')
Pre-text processing
DETAILS
  64 samples
  0 invalid documents
  27.95 words per sample on average
  Number of unique words 778
  1789.00 total words

Post-text processing
DETAILS
  64 samples
  0 invalid documents
  17.31 words per sample on average
  Number of unique words 489
  1108.00 total words
Visualizing entropy of clustering technique pre- and post- processing
[67]:
fig = e.visualize_cluster_entropy([DATA_COLUMN, 'CleanDesc'])
plt.show()

Functionality 1.3: Frequency plot
[68]:
# Frequency plot on unprocessed data
fig = e.visualize_freqPlot(LBL_CAT='inverter', DATA_COLUMN=DATA_COLUMN)
plt.show()

[69]:
# Frequency plot on processed data
fig = e.visualize_freqPlot(LBL_CAT='inverter',
                            # Optional, kwargs into nltk's FreqDist
                            graph_aargs = {
                                'linewidth':4
                            }
                        )
plt.show()

Hint: Use the below code to visualize frequency plots for all assets
set_labels = list(set(e.df[e.LABEL_COLUMN].tolist()))
for lbl in set_labels:
    fig = e.visualize_freqPlot(LBL_CAT=lbl)
    plt.show()
[70]:
# Only supports two attributes
om_col_dict = {
    'attribute1_col': 'Asset',
    'attribute2_col': 'ImpactLevel'
}

fig, G = e.visualize_attribute_connectivity(
    om_col_dict,
    figsize=[10,5],
    graph_aargs = {'with_labels':True,
    'font_weight':'bold',
    'node_size': 1000,
    'font_size':10}
)

Functionality 2.1: Conduct supervised classification on tickets using a cross-validated grid search
[71]:
# Setting few cross validation splits because of few example data
results, best_model = e.classify_supervised(n_cv_splits=2, embedding='tfidf')
print('best_model', best_model)
results
Starting ML analysis with TF-IDF embeddings
/home/klbonne/.pyenv/versions/3.11.5/envs/pvops/lib/python3.11/site-packages/sklearn/linear_model/_sag.py:350: ConvergenceWarning: The max_iter was reached which means the coef_ did not converge
  warnings.warn(
/home/klbonne/.pyenv/versions/3.11.5/envs/pvops/lib/python3.11/site-packages/sklearn/linear_model/_sag.py:350: ConvergenceWarning: The max_iter was reached which means the coef_ did not converge
  warnings.warn(
/home/klbonne/.pyenv/versions/3.11.5/envs/pvops/lib/python3.11/site-packages/sklearn/linear_model/_sag.py:350: ConvergenceWarning: The max_iter was reached which means the coef_ did not converge
  warnings.warn(
/home/klbonne/.pyenv/versions/3.11.5/envs/pvops/lib/python3.11/site-packages/sklearn/linear_model/_sag.py:350: ConvergenceWarning: The max_iter was reached which means the coef_ did not converge
  warnings.warn(
/home/klbonne/.pyenv/versions/3.11.5/envs/pvops/lib/python3.11/site-packages/sklearn/linear_model/_sag.py:350: ConvergenceWarning: The max_iter was reached which means the coef_ did not converge
  warnings.warn(
/home/klbonne/.pyenv/versions/3.11.5/envs/pvops/lib/python3.11/site-packages/sklearn/linear_model/_sag.py:350: ConvergenceWarning: The max_iter was reached which means the coef_ did not converge
  warnings.warn(
/home/klbonne/.pyenv/versions/3.11.5/envs/pvops/lib/python3.11/site-packages/sklearn/linear_model/_sag.py:350: ConvergenceWarning: The max_iter was reached which means the coef_ did not converge
  warnings.warn(
/home/klbonne/.pyenv/versions/3.11.5/envs/pvops/lib/python3.11/site-packages/sklearn/linear_model/_sag.py:350: ConvergenceWarning: The max_iter was reached which means the coef_ did not converge
  warnings.warn(
/home/klbonne/.pyenv/versions/3.11.5/envs/pvops/lib/python3.11/site-packages/sklearn/linear_model/_sag.py:350: ConvergenceWarning: The max_iter was reached which means the coef_ did not converge
  warnings.warn(
/home/klbonne/.pyenv/versions/3.11.5/envs/pvops/lib/python3.11/site-packages/sklearn/linear_model/_sag.py:350: ConvergenceWarning: The max_iter was reached which means the coef_ did not converge
  warnings.warn(
/home/klbonne/.pyenv/versions/3.11.5/envs/pvops/lib/python3.11/site-packages/sklearn/linear_model/_sag.py:350: ConvergenceWarning: The max_iter was reached which means the coef_ did not converge
  warnings.warn(
/home/klbonne/.pyenv/versions/3.11.5/envs/pvops/lib/python3.11/site-packages/sklearn/linear_model/_sag.py:350: ConvergenceWarning: The max_iter was reached which means the coef_ did not converge
  warnings.warn(
/home/klbonne/.pyenv/versions/3.11.5/envs/pvops/lib/python3.11/site-packages/sklearn/linear_model/_sag.py:350: ConvergenceWarning: The max_iter was reached which means the coef_ did not converge
  warnings.warn(
/home/klbonne/.pyenv/versions/3.11.5/envs/pvops/lib/python3.11/site-packages/sklearn/linear_model/_sag.py:350: ConvergenceWarning: The max_iter was reached which means the coef_ did not converge
  warnings.warn(
/home/klbonne/.pyenv/versions/3.11.5/envs/pvops/lib/python3.11/site-packages/sklearn/linear_model/_sag.py:350: ConvergenceWarning: The max_iter was reached which means the coef_ did not converge
  warnings.warn(
/home/klbonne/.pyenv/versions/3.11.5/envs/pvops/lib/python3.11/site-packages/sklearn/linear_model/_sag.py:350: ConvergenceWarning: The max_iter was reached which means the coef_ did not converge
  warnings.warn(
/home/klbonne/.pyenv/versions/3.11.5/envs/pvops/lib/python3.11/site-packages/sklearn/linear_model/_sag.py:350: ConvergenceWarning: The max_iter was reached which means the coef_ did not converge
  warnings.warn(
/home/klbonne/.pyenv/versions/3.11.5/envs/pvops/lib/python3.11/site-packages/sklearn/linear_model/_sag.py:350: ConvergenceWarning: The max_iter was reached which means the coef_ did not converge
  warnings.warn(
/home/klbonne/.pyenv/versions/3.11.5/envs/pvops/lib/python3.11/site-packages/sklearn/linear_model/_sag.py:350: ConvergenceWarning: The max_iter was reached which means the coef_ did not converge
  warnings.warn(
/home/klbonne/.pyenv/versions/3.11.5/envs/pvops/lib/python3.11/site-packages/sklearn/linear_model/_sag.py:350: ConvergenceWarning: The max_iter was reached which means the coef_ did not converge
  warnings.warn(
best_model Pipeline(steps=[('tfidf', TfidfVectorizer(ngram_range=(1, 3))),
                ('clf', AdaBoostClassifier())])
[71]:
| estimator | min_score | mean_score | max_score | std_score | mean_fit_time | clf__C | clf__max_iter | tfidf__ngram_range | tfidf__stop_words | ... | clf__splitter | clf__alpha | clf__batch_size | clf__hidden_layer_sizes | clf__learning_rate | clf__solver | clf__loss | clf__n_estimators | clf__max_samples | clf__algorithm | |
|---|---|---|---|---|---|---|---|---|---|---|---|---|---|---|---|---|---|---|---|---|---|
| 67 | AdaBoostClassifier | 0.445812 | 0.487584 | 0.529356 | 0.041772 | 0.20235 | NaN | NaN | (1, 3) | None | ... | NaN | NaN | NaN | NaN | 0.8 | NaN | NaN | 100 | NaN | SAMME.R |
| 66 | AdaBoostClassifier | 0.445812 | 0.487584 | 0.529356 | 0.041772 | 0.10263 | NaN | NaN | (1, 3) | None | ... | NaN | NaN | NaN | NaN | 0.8 | NaN | NaN | 50 | NaN | SAMME.R |
| 65 | AdaBoostClassifier | 0.445812 | 0.487584 | 0.529356 | 0.041772 | 0.207092 | NaN | NaN | (1, 3) | None | ... | NaN | NaN | NaN | NaN | 0.9 | NaN | NaN | 100 | NaN | SAMME.R |
| 64 | AdaBoostClassifier | 0.445812 | 0.487584 | 0.529356 | 0.041772 | 0.103079 | NaN | NaN | (1, 3) | None | ... | NaN | NaN | NaN | NaN | 0.9 | NaN | NaN | 50 | NaN | SAMME.R |
| 62 | AdaBoostClassifier | 0.445812 | 0.487584 | 0.529356 | 0.041772 | 0.100246 | NaN | NaN | (1, 3) | None | ... | NaN | NaN | NaN | NaN | 1.0 | NaN | NaN | 50 | NaN | SAMME.R |
| ... | ... | ... | ... | ... | ... | ... | ... | ... | ... | ... | ... | ... | ... | ... | ... | ... | ... | ... | ... | ... | ... |
| 6 | SVC | 0.234722 | 0.234722 | 0.234722 | 0.0 | 0.006326 | 1.0 | NaN | (1, 3) | None | ... | NaN | NaN | NaN | NaN | NaN | NaN | NaN | NaN | NaN | NaN |
| 5 | SVC | 0.234722 | 0.234722 | 0.234722 | 0.0 | 0.006342 | 1.0 | NaN | (1, 3) | None | ... | NaN | NaN | NaN | NaN | NaN | NaN | NaN | NaN | NaN | NaN |
| 4 | SVC | 0.221591 | 0.228157 | 0.234722 | 0.006566 | 0.005903 | 1.0 | NaN | (1, 3) | None | ... | NaN | NaN | NaN | NaN | NaN | NaN | NaN | NaN | NaN | NaN |
| 39 | PassiveAggressiveClassifier | NaN | NaN | NaN | NaN | 0.0048 | 0.0 | NaN | (1, 3) | None | ... | NaN | NaN | NaN | NaN | NaN | NaN | hinge | NaN | NaN | NaN |
| 40 | PassiveAggressiveClassifier | NaN | NaN | NaN | NaN | 0.004441 | 0.0 | NaN | (1, 3) | None | ... | NaN | NaN | NaN | NaN | NaN | NaN | squared_hinge | NaN | NaN | NaN |
68 rows × 25 columns
Functionality 1.4: Conduct unsupervised clustering on tickets using a cross-validated grid search
[78]:
# Setting few cross validation splits because of few example data
results, best_model = e.classify_unsupervised(n_cv_splits=2, embedding='tfidf')
print('best_model', best_model)
results
Starting ML analysis with TF-IDF embeddings
/home/klbonne/.pyenv/versions/3.11.5/envs/pvops/lib/python3.11/site-packages/sklearn/cluster/_birch.py:726: ConvergenceWarning: Number of subclusters found (1) by BIRCH is less than (11). Decrease the threshold.
  warnings.warn(
/home/klbonne/.pyenv/versions/3.11.5/envs/pvops/lib/python3.11/site-packages/sklearn/cluster/_birch.py:726: ConvergenceWarning: Number of subclusters found (1) by BIRCH is less than (11). Decrease the threshold.
  warnings.warn(
/home/klbonne/.pyenv/versions/3.11.5/envs/pvops/lib/python3.11/site-packages/sklearn/cluster/_birch.py:726: ConvergenceWarning: Number of subclusters found (1) by BIRCH is less than (11). Decrease the threshold.
  warnings.warn(
/home/klbonne/.pyenv/versions/3.11.5/envs/pvops/lib/python3.11/site-packages/sklearn/cluster/_birch.py:726: ConvergenceWarning: Number of subclusters found (1) by BIRCH is less than (11). Decrease the threshold.
  warnings.warn(
best_model Pipeline(steps=[('tfidf', TfidfVectorizer(ngram_range=(1, 3))),
                ('to_dense', DataDensifier()), ('clf', Birch(n_clusters=11))])
[78]:
| estimator | min_score | mean_score | max_score | std_score | mean_fit_time | clf__damping | clf__max_iter | tfidf__ngram_range | tfidf__stop_words | clf__branching_factor | clf__n_clusters | clf__threshold | clf__init | clf__n_init | clf__bandwidth | clf__bin_seeding | |
|---|---|---|---|---|---|---|---|---|---|---|---|---|---|---|---|---|---|
| 7 | Birch | 0.629666 | 0.647877 | 0.666088 | 0.018211 | 0.007 | NaN | NaN | (1, 3) | None | 100 | 11 | 0.5 | NaN | NaN | NaN | NaN |
| 4 | Birch | 0.629666 | 0.647877 | 0.666088 | 0.018211 | 0.007483 | NaN | NaN | (1, 3) | None | 50 | 11 | 0.5 | NaN | NaN | NaN | NaN |
| 1 | AffinityPropagation | 0.42079 | 0.522839 | 0.624887 | 0.102048 | 0.010927 | 0.5 | 600 | (1, 3) | None | NaN | NaN | NaN | NaN | NaN | NaN | NaN |
| 3 | AffinityPropagation | 0.42079 | 0.517806 | 0.614823 | 0.097016 | 0.010343 | 0.9 | 600 | (1, 3) | None | NaN | NaN | NaN | NaN | NaN | NaN | NaN |
| 0 | AffinityPropagation | 0.425789 | 0.507145 | 0.588502 | 0.081356 | 0.010901 | 0.5 | 200 | (1, 3) | None | NaN | NaN | NaN | NaN | NaN | NaN | NaN |
| 2 | AffinityPropagation | 0.425789 | 0.503147 | 0.580505 | 0.077358 | 0.013031 | 0.9 | 200 | (1, 3) | None | NaN | NaN | NaN | NaN | NaN | NaN | NaN |
| 13 | KMeans | 0.303348 | 0.434765 | 0.566182 | 0.131417 | 0.01097 | NaN | NaN | (1, 3) | None | NaN | 11 | NaN | random | 10 | NaN | NaN |
| 15 | KMeans | 0.368506 | 0.407506 | 0.446506 | 0.039 | 0.057041 | NaN | NaN | (1, 3) | None | NaN | 11 | NaN | random | 100 | NaN | NaN |
| 10 | KMeans | 0.22441 | 0.317554 | 0.410697 | 0.093144 | 0.06142 | NaN | NaN | (1, 3) | None | NaN | 11 | NaN | k-means++ | 10 | NaN | NaN |
| 14 | KMeans | 0.268359 | 0.303465 | 0.338572 | 0.035107 | 0.034123 | NaN | NaN | (1, 3) | None | NaN | 11 | NaN | random | 50 | NaN | NaN |
| 12 | KMeans | 0.268081 | 0.298927 | 0.329774 | 0.030847 | 0.221901 | NaN | NaN | (1, 3) | None | NaN | 11 | NaN | k-means++ | 100 | NaN | NaN |
| 11 | KMeans | 0.289608 | 0.29647 | 0.303332 | 0.006862 | 0.098513 | NaN | NaN | (1, 3) | None | NaN | 11 | NaN | k-means++ | 50 | NaN | NaN |
| 16 | MiniBatchKMeans | 0.265281 | 0.277444 | 0.289608 | 0.012163 | 0.015522 | NaN | NaN | (1, 3) | None | NaN | 11 | NaN | k-means++ | 3 | NaN | NaN |
| 5 | Birch | 0.157604 | 0.23402 | 0.310436 | 0.076416 | 0.008387 | NaN | NaN | (1, 3) | None | 50 | 11 | 0.75 | NaN | NaN | NaN | NaN |
| 8 | Birch | 0.157604 | 0.23402 | 0.310436 | 0.076416 | 0.008248 | NaN | NaN | (1, 3) | None | 100 | 11 | 0.75 | NaN | NaN | NaN | NaN |
| 20 | MiniBatchKMeans | 0.110475 | 0.183592 | 0.25671 | 0.073117 | 0.010481 | NaN | NaN | (1, 3) | None | NaN | 11 | NaN | random | 10 | NaN | NaN |
| 17 | MiniBatchKMeans | 0.036041 | 0.160629 | 0.285217 | 0.124588 | 0.028212 | NaN | NaN | (1, 3) | None | NaN | 11 | NaN | k-means++ | 10 | NaN | NaN |
| 21 | MiniBatchKMeans | 0.0 | 0.131439 | 0.262878 | 0.131439 | 0.015208 | NaN | NaN | (1, 3) | None | NaN | 11 | NaN | random | 20 | NaN | NaN |
| 19 | MiniBatchKMeans | 0.0 | 0.086007 | 0.172015 | 0.086007 | 0.010238 | NaN | NaN | (1, 3) | None | NaN | 11 | NaN | random | 3 | NaN | NaN |
| 18 | MiniBatchKMeans | 0.065271 | 0.085739 | 0.106208 | 0.020469 | 0.040977 | NaN | NaN | (1, 3) | None | NaN | 11 | NaN | k-means++ | 20 | NaN | NaN |
| 23 | MeanShift | 0.0 | 0.0 | 0.0 | 0.0 | 0.050849 | NaN | 600 | (1, 3) | None | NaN | NaN | NaN | NaN | NaN | None | False |
| 24 | MeanShift | 0.0 | 0.0 | 0.0 | 0.0 | 0.016261 | NaN | 300 | (1, 3) | None | NaN | NaN | NaN | NaN | NaN | None | True |
| 6 | Birch | 0.0 | 0.0 | 0.0 | 0.0 | 0.006244 | NaN | NaN | (1, 3) | None | 50 | 11 | 1.0 | NaN | NaN | NaN | NaN |
| 22 | MeanShift | 0.0 | 0.0 | 0.0 | 0.0 | 0.045921 | NaN | 300 | (1, 3) | None | NaN | NaN | NaN | NaN | NaN | None | False |
| 9 | Birch | 0.0 | 0.0 | 0.0 | 0.0 | 0.005972 | NaN | NaN | (1, 3) | None | 100 | 11 | 1.0 | NaN | NaN | NaN | NaN |
| 25 | MeanShift | 0.0 | 0.0 | 0.0 | 0.0 | 0.015578 | NaN | 600 | (1, 3) | None | NaN | NaN | NaN | NaN | NaN | None | True |
[73]:
e.predict_best_model(ml_type = 'supervised')
Best algorithm found:
 Pipeline(steps=[('tfidf', TfidfVectorizer(ngram_range=(1, 3))),
                ('clf', AdaBoostClassifier())])
Predictions stored to Supervised_Pred_Asset in `df` attribute
Score: 0.5729910714285715
[74]:
e.predict_best_model(ml_type = 'unsupervised')
Best algorithm found:
 Pipeline(steps=[('tfidf', TfidfVectorizer(ngram_range=(1, 3))),
                ('to_dense', DataDensifier()),
                ('clf', AffinityPropagation(damping=0.9, max_iter=600))])
Predictions stored to Unsupervised_Pred_Asset in `df` attribute
Score: 0.42789964962778615
[75]:
e.LABEL_COLUMN = 'Unsupervised_Pred_Asset'
e.visualize_freqPlot(LBL_CAT = 1)

[75]:
FreqDist({'tracking': 8, 'tracker': 7, 'row': 5, 'good': 5, 'winch': 4, 'reset': 3, 'skid': 3, 'flat': 2, 'trackers': 2, 'techdispatched': 2, ...})
Visualize Word Clusters
[76]:
fig = e.visualize_document_clusters(min_frequency=10, DATA_COLUMN='CleanDesc')
plt.show()
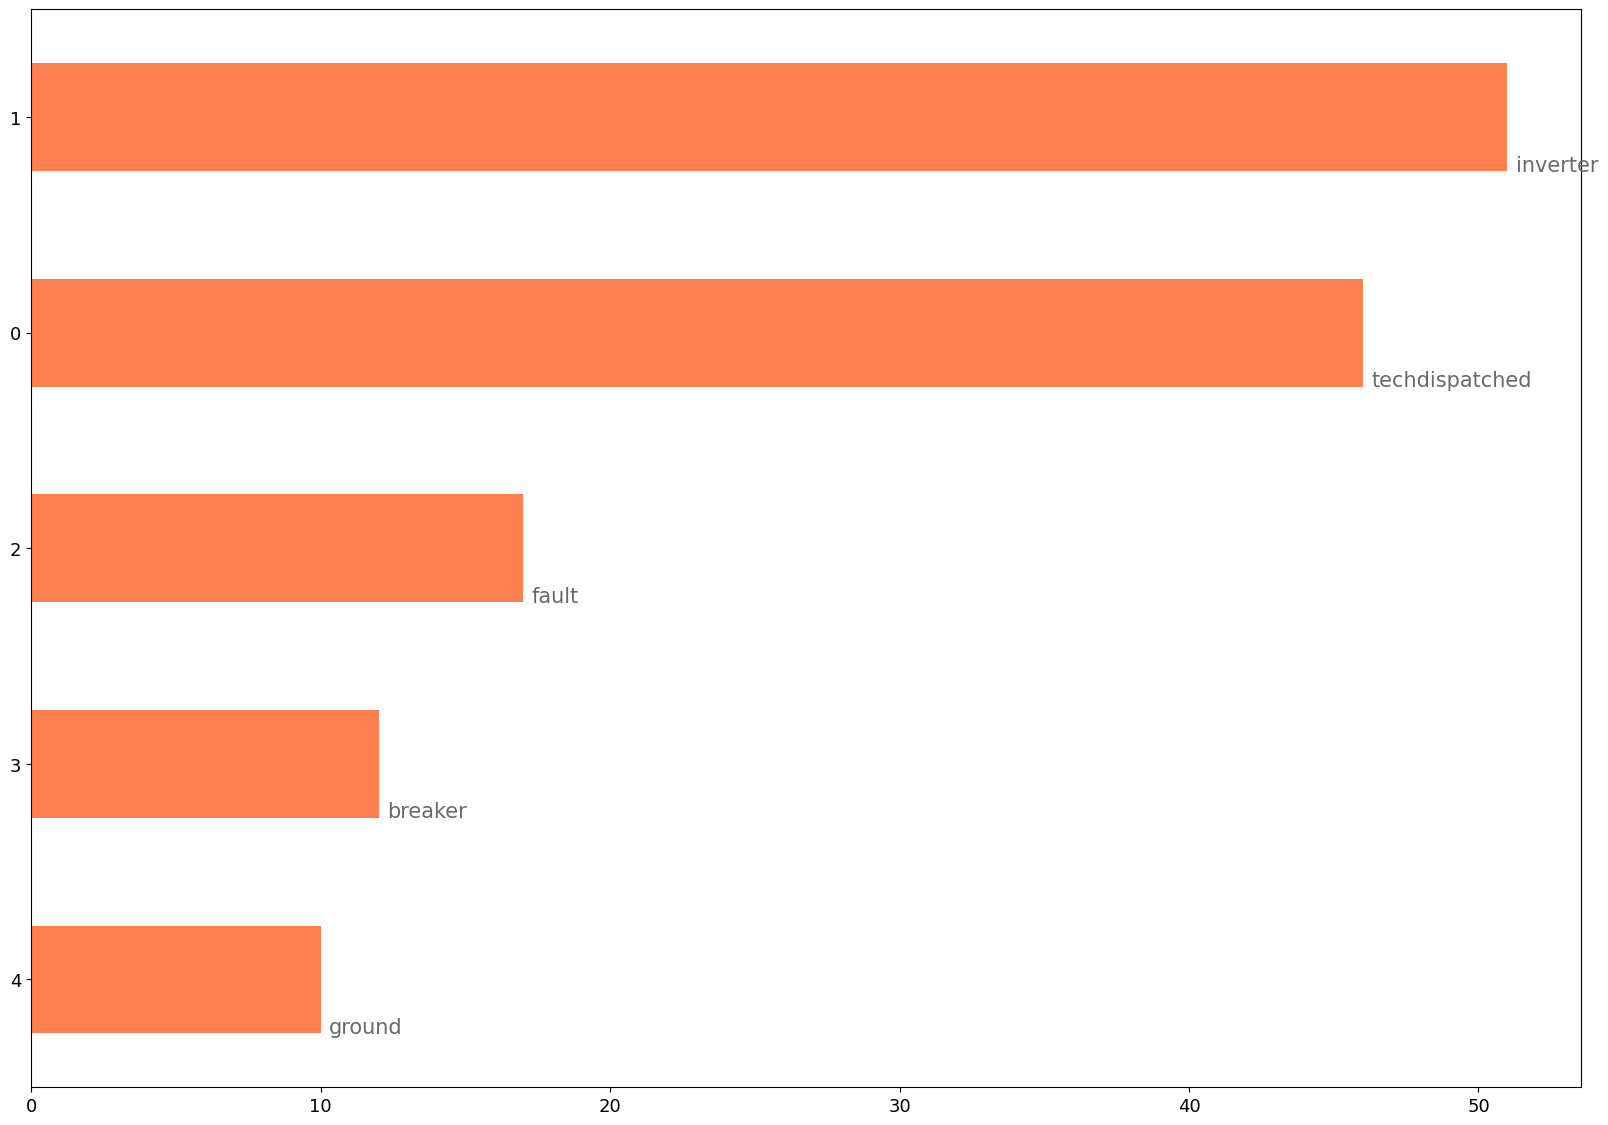
Seeing the popularity of techdispatched, one might consider adding techdispatched to the stopwords list